Step 1
Optimize
Solve your problem
Step 2
Simulate
Build your process simulator
Step 3
Analyze
Build your dashboard
Step 4
Fine tune
Build your statistical model
Define & frame your process challenge
Together with consultant support, we build your improvement roadmap
Teams start by mapping the real pain — cycle time, defect rate, yield loss. This step anchors every tool built afterward to your actual production reality.
Phase 1
Define problem
Phase 2
Characterize process performance
Phase 3
Optimize process
DMAIC deployment
Structured framework
Data collection plan & acquisition
Project deliverable
Board-ready results
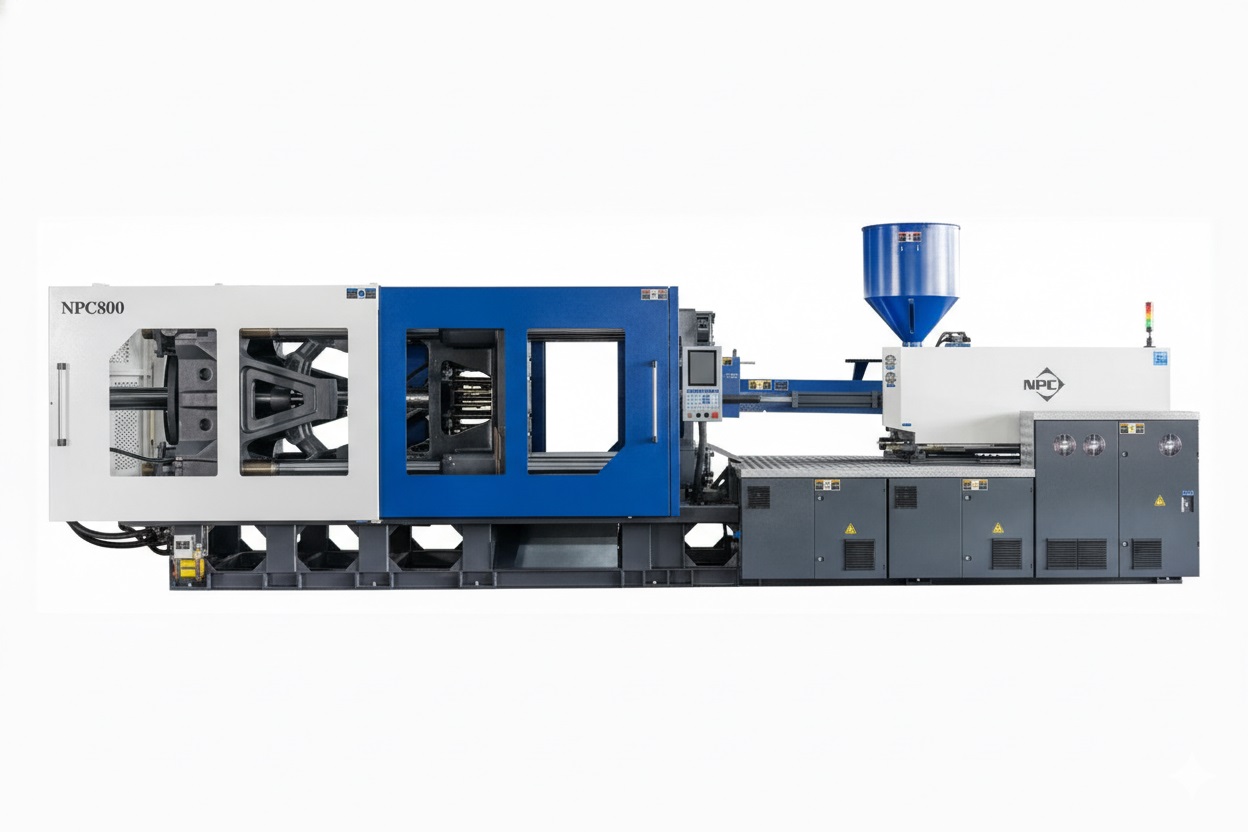
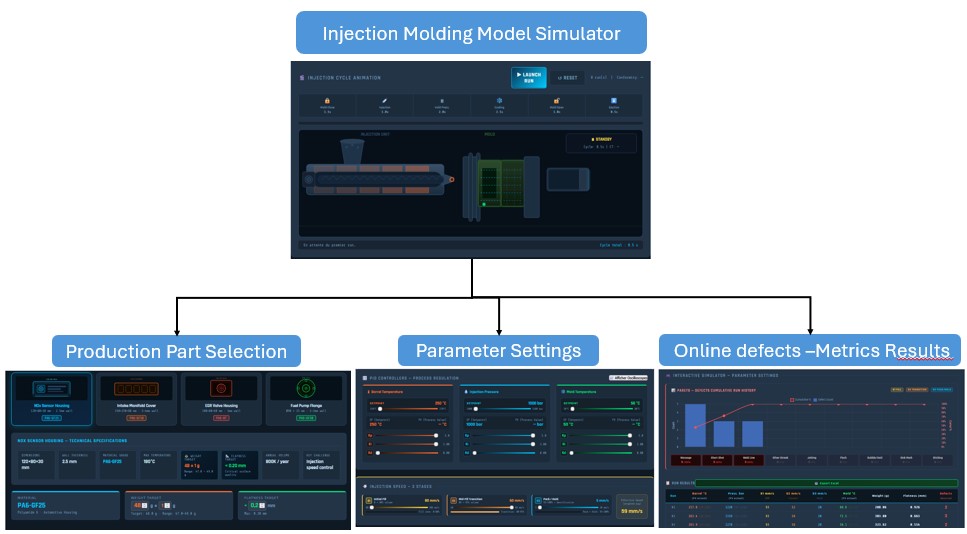
Build a live simulator of your process
Together with consultant support, we build your custom process simulator
Teams code an interactive simulator using your machine parameters, materials, and tolerances — not a generic demo. Operators run what-if scenarios before touching the real line.
∞
Scenarios testable
3.4 ppm
Scrap target
1
Tool per trainee
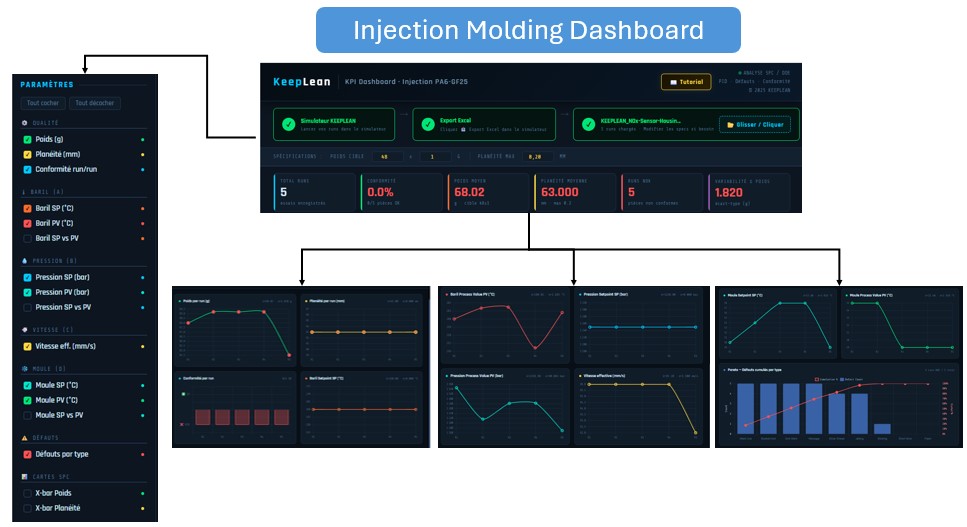
Deploy a live KPI dashboard on your process simulator
Together with consultant support, we build your live monitoring system
Trainees build a real-time dashboard with SPC charts, Pareto analysis, and OEE tracking — wired to your actual KPIs. Ready to embed in your operations the day training ends.
Day 1
ROI visible
ISO
17024 aligned
Live
After training
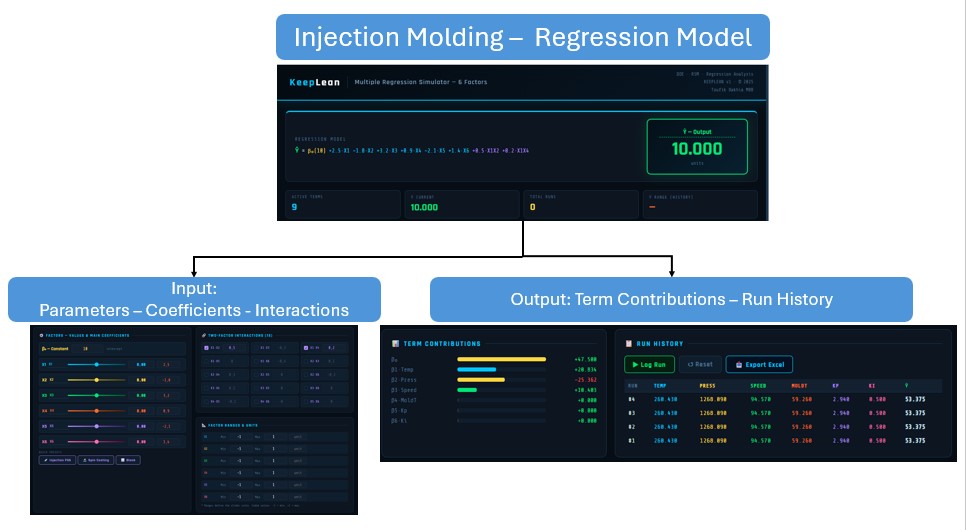
Build a predictive regression model for your process
Together with consultant support, we build your predictive decision tool
The final deliverable: a multivariate regression model with interaction terms, fitted to your process data. Teams use it to predict output before running a single part.
All factors
Modelled
R² adj.
Optimized fit
Your team
Tools they keep & use
Ready to see what your team will build?
Request a free live demo — we run your process through all 4 steps in real time.