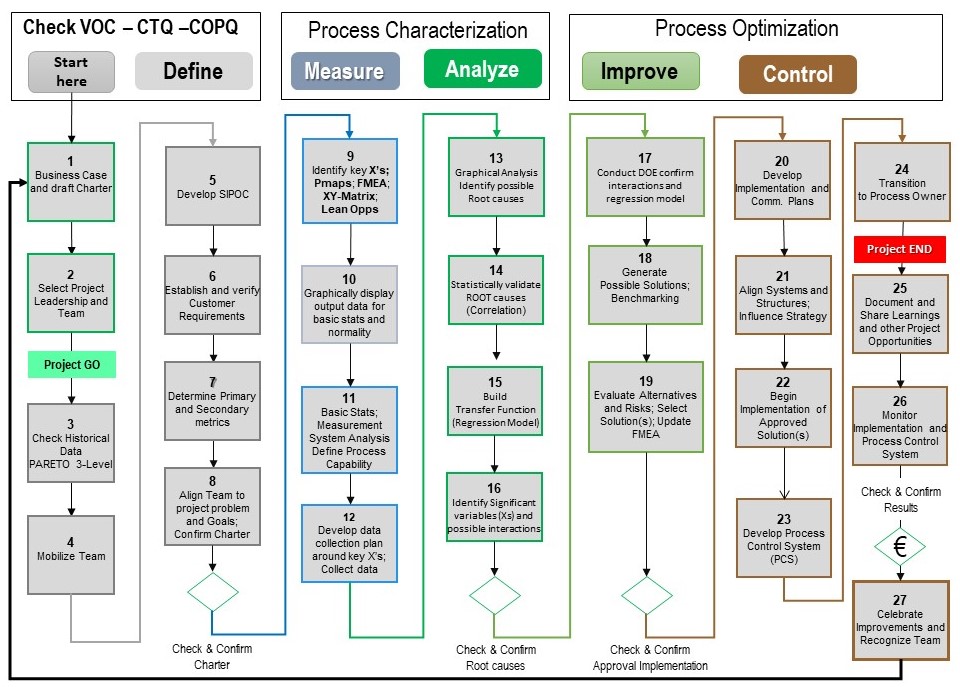
The concept is based on the application of theory following six sigma teaching model. For this we have put the DMAIC roadmap to help the participant see the position of each tool in the DMAIC.
The specific readng Learning Outcome Statements (LOS) contained in the study material are designed to indicate what you should learn from each assignment to conduct project.
Cette feuille de route de PPS (Practical Problem Solving) est dédiée au suivi de la gestion du projet.
Nous avons préparé une feuille de route complète et facile à comprendre qui est conçue pour poser les bonnes questions avec les bonnes réponses et les bons outils, pour collecter les bonnes données à analyser.
Each DMAIC step, we have set up a flowchart which gives us a sequential path in order to assemble the useful information to characterize the process in the right end-to-end conditions in order to carry out a reliable optimization.
In conclusion, this approach is a guide line to drive a project to achieve the target objective:
Under control - Stable - Repeatable - Predictable.


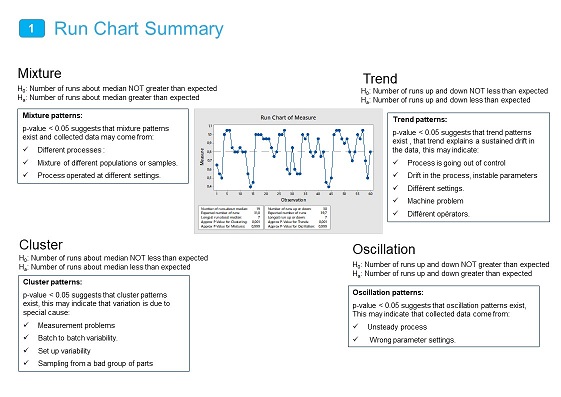
The flashcards are flip cards.
on one side you have the statistical tool with an illustration and a brief explanation.
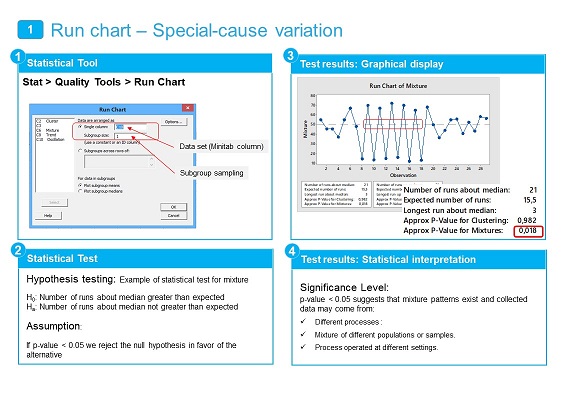
the other side is the use of the statistical tool represented in 4 quadrants:
Quadrant 1, shows how to access the tool in Minitab
Quandrant 2, informs us about the type of statistical test to be conducted.
Quandrant 3: represents the graphical result of the observations.
Quandrant 4: statistical confirmation of our observations
(it shows the statistical interpretation of the data to confirm what we saw graphically)
created with
Best Free Website Builder .